rpaleoclim v1.0.0: paleoclimate data in R
PaleoClim (Brown et al. 2018, Scientific Data) is a set of high-resolution paleoclimate surfaces covering the whole world. The data is derived from HadCM3, one of the major ‘general circulation models’ that is used to forecast climate change, turned backwards to ‘predict’ conditions for key climate periods in the past. This is then ‘downscaled’ to a high spatial resolution (up to 2.5 minutes) using modern climate data. A continuous set of reconstructions from the near-present to the Last Glacial Maximum (c. 0.3–21 ka, divided into 7 periods) are available, plus snapshots for the Last Interglacial (c. 130 ka), MIS19 (c. 787 ka), mid-Pliocene (c. 3.205 Ma and 3.3 Ma). For convenience, modern data from CHELSA (used for downscaling) is also bundled in the same format.
PaleoClim is my go-to paleoclimate dataset for modelling prehistoric environments because as far as I know it has the best spatial resolution available for my main period of interest, the Late Pleistocene and Early Holocene.1 It’s also generally more accessible and easier to use than ‘raw’ GCM predictions and the choice of time slices is a good fit for prehistoric archaeology.2 Its API is very simple: from the PaleoClim website you can download archives for each period at a number of resolutions, with each archive including a set of GeoTIFFs representing the 19 bioclimatic variables widely used in ecological modelling.
Alternatively, rpaleoclim is a simple R package that automates the process of downloading, reading and cropping PaleoClim data. It’s been availble on GitHub for a few years, but the latest release v1.0.0 adds support for terra-format rasters and also brings the package to CRAN. This means you can now install it easily with:
install.packages("rpaleoclim")
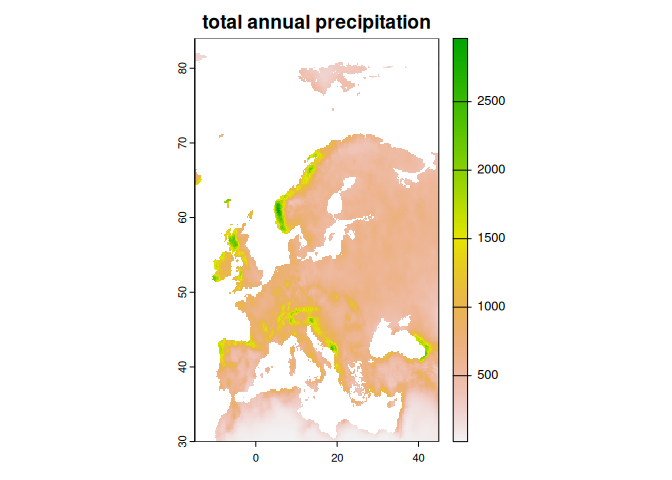
The way I usually use rpaleoclim is to get the reconstructions for a particular region for a set of periods. For example, Europe in the Late Holocene:
library("rpaleoclim")
library("terra")

europe <- c(-15, 45, 30, 90)
europe_lh <- paleoclim("lh", "10m", region = europe)

plot(europe_lh[["bio_12"]], main = "total annual precipitation")
Further functionality is explained in the introduction to
rpaleoclim
vignette. One thing I’d highlight is the caching facility, which my
default uses a temporary directory to store downloaded PaleoClim for the
length of the R session. To keep things reproducible, I recommend using
the cache_path argument to use a location within your project
directory instead.3 That way, if the online versions of the PastClim
data ever disappears or moves, the dataset you rely on will still be
there – something I’ve been caught out by many, many times!
Please note that rpaleoclim simply provides a convenient way to use the PaleoClim dataset in R; I don’t claim any credit for the actual data. If you use it in a publication, the PaleoClim authors request that you cite both their derived dataset (i.e. PaleoClim, Brown et al. 2018) and the original climatologies used. These references are included in the package:
citation("rpaleoclim")
## Please cite both PaleoClim and original datasets used.
##
## PaleoClim and dataset 'mis19':
##
##   Brown Jason L, et al. "PaleoClim, high spatial resolution
##   paleoclimate surfaces for global land areas". Scientific Data 5.
##   (2018): 180254.
##
## Datasets 'lh', 'mh', 'eh', 'yds', 'ba' and 'hs1':
##
##   Fordham Damien A, et al. "PaleoView: a tool for generating continuous
##   climate projections spanning the last 21 000 years at regional and
##   global scales". Ecography 40. (2017): 1348-1358.
##
## Dataset 'lig':
##
##   Otto-Bliesner Bette L., et al. "Simulating Arctic Climate Warmth and
##   Icefield Retreat in the Last Interglaciation". Science 311. (2006):
##   1751-1753.
##
## Dataset 'mpwp':
##
##   Hill Daniel J. "The non-analogue nature of Pliocene temperature
##   gradients ". Earth and Planetary Science Letters 425. (2015):
##   232-241.
##
## Dataset 'm2':
##
##   Dolan Aisling M, et al. "Modelling the enigmatic Late Pliocene
##   Glacial Event — Marine Isotope Stage M2". Global and Planetary Change
##   128. (2015): 47-60.
##
## Dataset 'cur' and 'lgm' (CHELSA):
##
##   Karger Dirk Nikolaus, et al. "Climatologies at high resolution for
##   the earth’s land surface areas". Scientific Data 4. (2017): 170122.
##
## To see these entries in BibTeX format, use 'print(<citation>,
## bibtex=TRUE)', 'toBibtex(.)', or set
## 'options(citation.bibtex.max=999)'.
Last year another package, pastclim was released offering similar functionality to rpaleoclim. It includes two datasets—Beyer et al. 2020 and Krapp et al. 2021—that considerably extends the range of reconstructions, as well as providing functions for processing new datasets in netCDF format. Unfortunately the spatial resolution of these datasets is quite coarse compared to PaleoClim (0.5°), so they’re not so useful for my purposes. So I’ll be keeping an eye on pastclim, but for the time being at least I intend to continue developing rpaleoclim. I would like to add support for complementary datasets like StableClim. I’m also unsure about whether to stick with terra for raster data or move to stars – any input on this is very welcome!
Notes
-
I could well be wrong. It’s been a few years since I actually looked into it. ↩
-
Even better would be PaleoView, which offers decadal temporal resolution over the last 21,000 years. Unfortunately, I could never get its Python-based frontend to run on Linux. ↩
-
Following the rrtools conventions, I use
analyis/data/derived_data. ↩